Feasibility · DCF Model
Hotel Development Feasibility & Investment Appraisal
Q-Park Tower Bridge Car Park: Proposed Hotel Conversion (London SE1)
Evaluated the proposed conversion of the Q-Park Tower Bridge car park into a 130-room upscale-lifestyle hotel. Built a 41-property competitive set, a five-year P&L and a ten-year equity cash-flow model.
Academic feasibility model, University of Surrey, modelled project outputs rather than realised investment returns.
The Brief
The Brief
Bolum Regeneration and English Rail commissioned an independent feasibility and investment appraisal for converting the Q-Park Tower Bridge car park in London SE1 into a 130-room hotel. The client profile carries two characteristics that shape the entire study: they are first-time hotel investors, and they do not want to operate the hotel themselves. These two constraints are the direct rationale for the brand and operating-structure recommendations later on.
The study answers four questions in sequence. Is the site suitable for a hotel? Is there room in the market for this product? Which brand and operating structure should be used to enter? And when the numbers are run, does the investment actually create value? The analysis therefore runs from site appraisal through competitive and demand analysis to a ten-year equity cash-flow model.
I produced the study as an individual academic assignment for the Hotel Investment and Finance module at the University of Surrey. I independently prepared everything in the analysis below, including the site and market appraisal, a 41-hotel competitive set, demand segmentation, brand and operating-structure recommendations, and the financial projections; one exception, covering certain template pages of the financial model, is noted at the bottom of the page.
Site Appraisal
46-50 Gainsford Street, SE1
The site sits within the Shad Thames Conservation Area, a historic dockland district on the south bank of the Thames. The existing structure is a red-brick warehouse building with repetitive arched openings reflecting 19th-century industrial heritage, currently operated as a rooftop car park by Q-Park. This is therefore not a new-build but an adaptive reuse project, which is both its greatest advantage and its greatest technical challenge.
On the advantage side is location: Tower Bridge, Butler’s Wharf and the riverside walkway are all within walking distance, while the City of London financial cluster feeds weekday demand. The established restaurant cluster at Butler’s Wharf also reduces the need for capital-intensive in-house F&B. Reusing the existing structure further aligns with institutional ESG priorities, since retrofit delivers embodied-carbon benefits over new build.
On the challenge side, Conservation Area status constrains external alterations and brand visibility, while converting a car park structure into a hotel requires structural adaptation, MEP installation and a fire-strategy redesign, making it more complex and costly than new build. The narrow Gainsford Street also limits construction logistics. These constraints are not incidental details; they form the technical rationale for the compact-room, lean-operation concept recommended later.
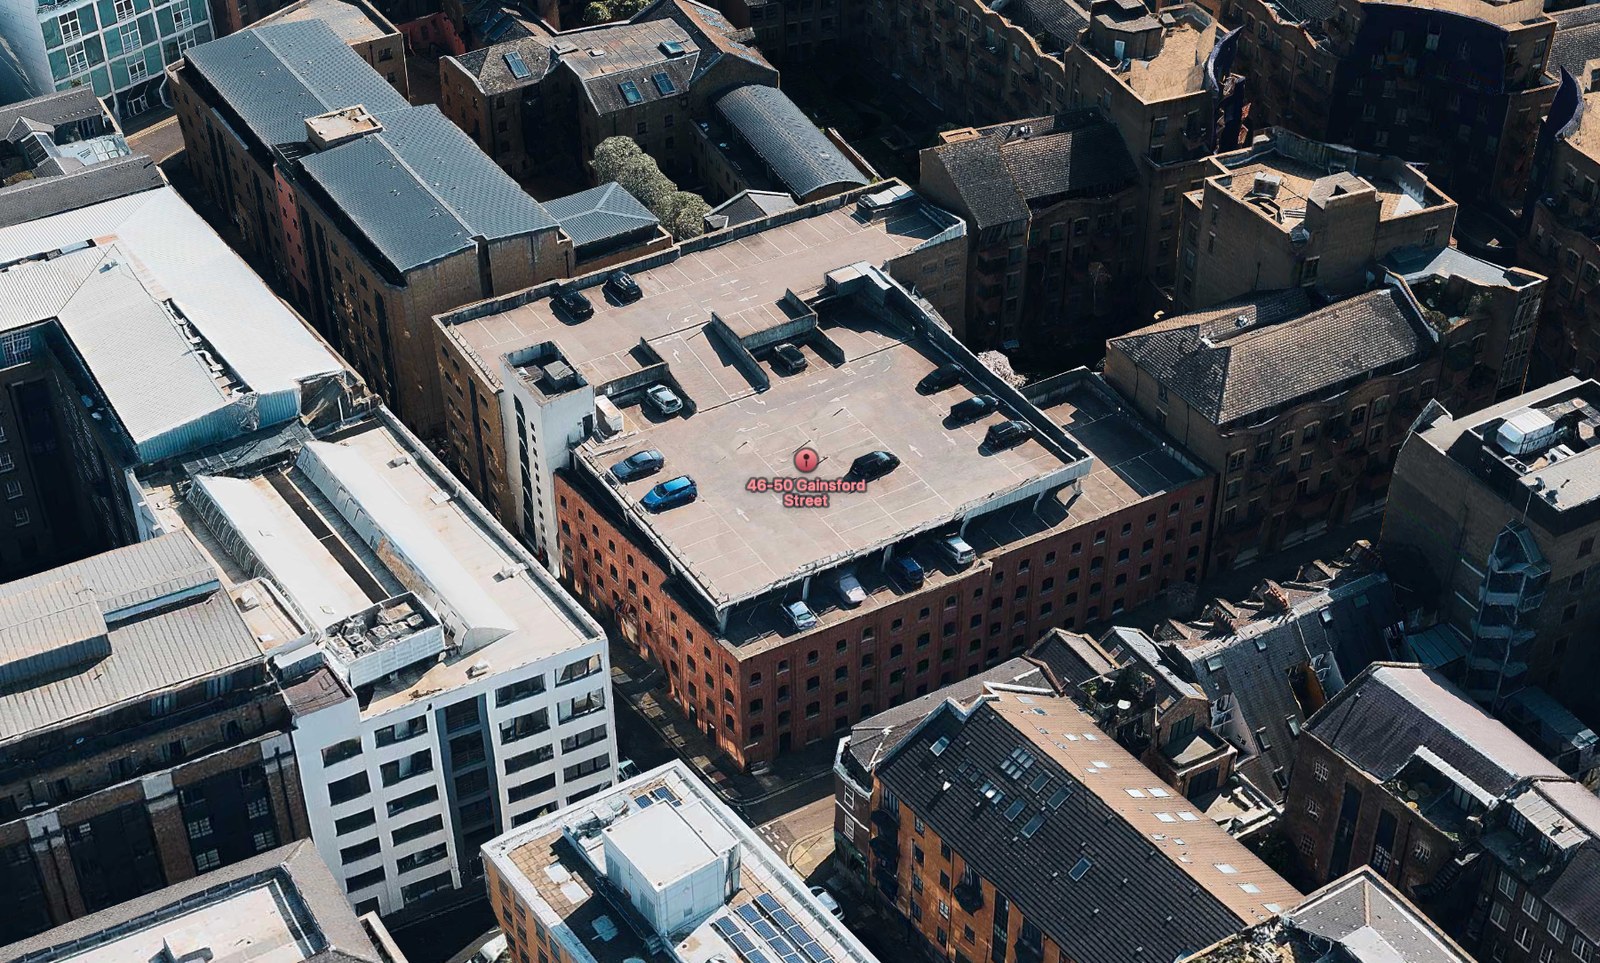
46-50 Gainsford Street, the existing Q-Park rooftop car park. Source: Apple Maps.
Competitive Landscape
A 41-Hotel Competitive Set
A suitable site isn’t enough on its own; the market also has to have room for the product. To test this I audited 41 hotels within a 2-mile radius, representing roughly 7,200 rooms from budget through luxury, and built a competitive set. Some 61% of supply is 4-star upscale product and 78% is branded, meaning this is a market dominated by chains rather than independents, and therefore a difficult one to enter without brand support.
Four hotels sit within 0.5 miles and are treated as primary competitors, providing the direct benchmark for pricing. ADR (Average Daily Rate) here means the average daily price per room sold, and is the most visible indicator of positioning.
The matrix below plots competitors by price (ADR) against luxury level. The resulting picture is clearly polarised: full-service upscale and luxury hotels sit at £348–£396 on one side, standardised budget and midscale product at £140–£230 on the other. In between, at £200–£250 ADR, sits a gap: room for a product offering design and character without a luxury price point. In the report I called this the "lean luxury" white space; it sits close to citizenM’s compact offering (£224) while remaining below full-service competitors. That gap is ideally suited to a concept serving design-conscious corporate and leisure travellers without building traditional F&B infrastructure.
| Hotel | Brand | Stars | Rooms | ADR | Key Differentiator |
|---|---|---|---|---|---|
| The Dixon | Marriott Autograph | 4★ | 193 | £348 | Heritage building; strong F&B |
| The Lalit London | Independent | 5★ | 70 | £396 | Spa-style; heritage focus |
| Mason & Fifth | Lifestyle aparthotel | 4★ | 28 | £158 | Cowork + kitchens |
| Bermonds Locke | Locke/edyn | 4★ | 143 | £206 | Design-led aparthotel |
Demand Analysis
A Balanced Corporate–Leisure Demand Base
The competitive analysis answers "where is the gap"; the demand analysis answers whether guests actually exist to fill it. I therefore split demand into six segments and examined when each travels and how price-sensitive it is.
The resulting pattern is the site’s most valuable characteristic: demand spreads across the whole week. Corporate guests dominate Monday to Thursday, fed by the City of London’s 678,000-strong workforce and 3.32 million international business visitors a year. At weekends demand shifts to leisure, drawing on London’s 20.95 million annual inbound visitors and walkable attractions such as the Tower of London (2.9m visitors/year), Tate Modern and Borough Market. The MICE segment adds a premium on top, with delegates spending 38% above the average visitor.
This dual pattern matters commercially: hotels dependent on a single segment are exposed to seasonality and demand shocks, whereas a hotel balancing weekday corporate with weekend leisure produces steadier year-round occupancy. That is the basis for the high occupancy assumption used in the financial model.
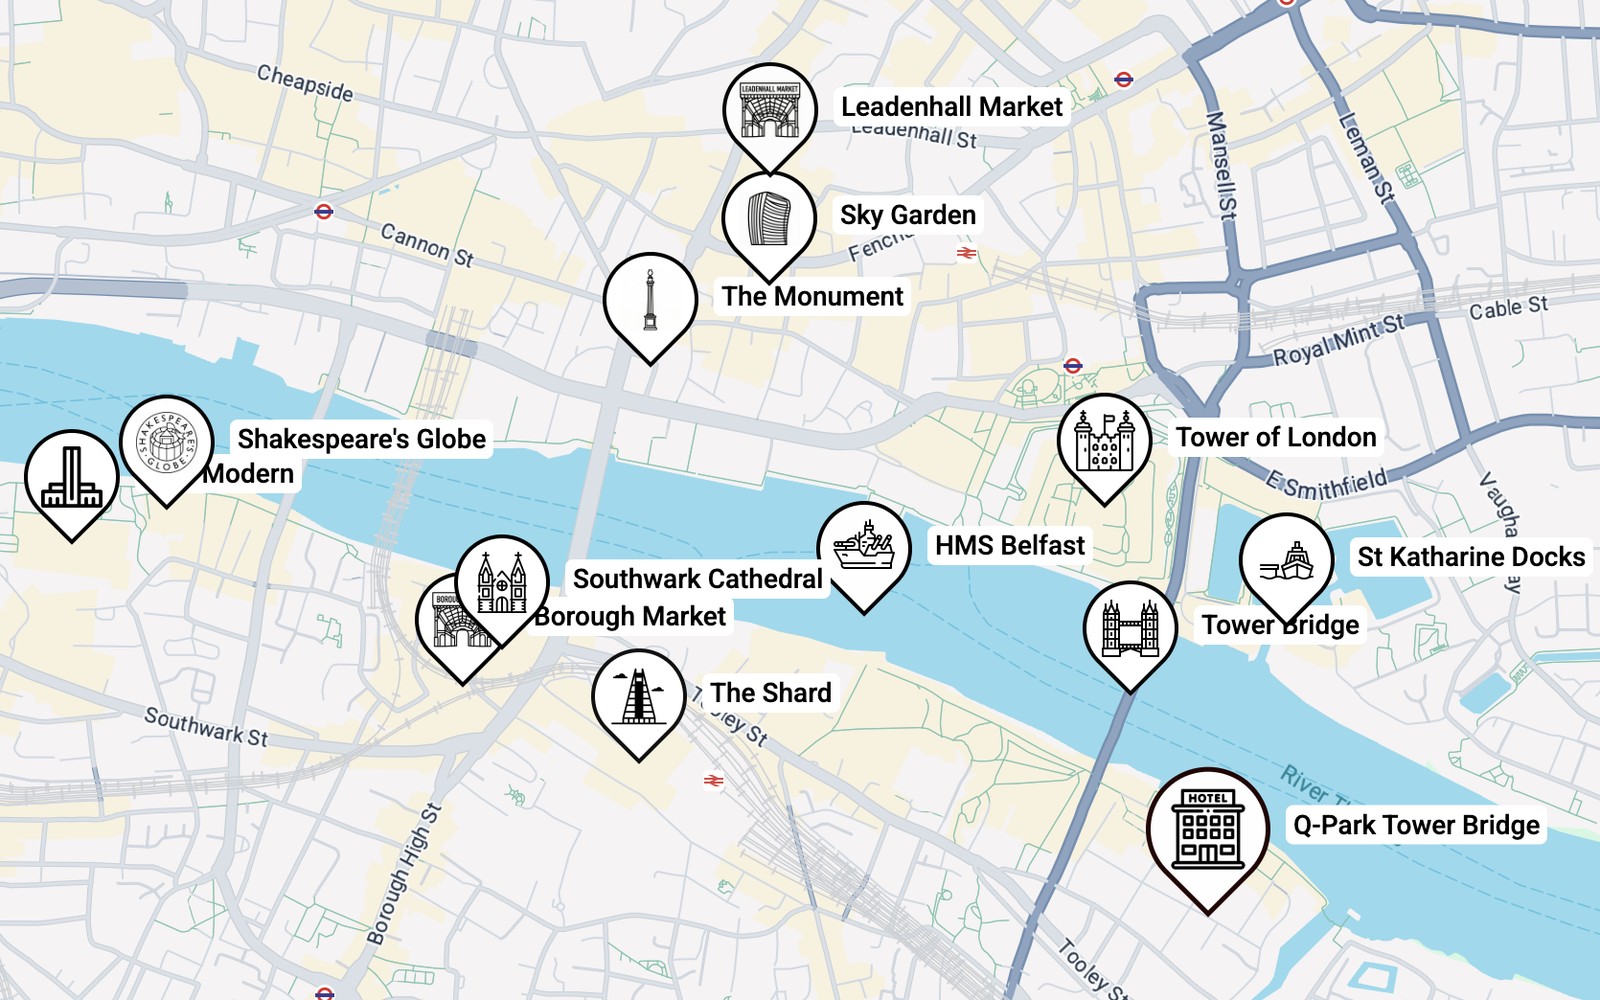
Demand-generator map: key attractions within walking distance of the site.
| Segment | Demand Drivers | Share | Rate Sensitivity |
|---|---|---|---|
| Corporate | City of London financial cluster (614,500 workers); 3.32m international business visitors/yr | 25–30% | Low |
| International Leisure | 20.95m inbound visitors; proximity to Tower of London, Tate Modern, Borough Market | 30–35% | Medium |
| Domestic Leisure | 15.5m overnight trips to London; weekend city breaks | 15–20% | Medium–High |
| MICE | £33.6bn UK business events sector; ExCeL London expansion | 10–15% | Low |
| VFR | 5.13m visitors, 24.5% of London arrivals | 5–8% | High |
| Medical/Other | Proximity to Guy’s & St Thomas’ NHS Trust | 3–5% | Variable |
Market Cycle & Supply
Entering a Mature Market, Not a Growing One
Demand may be strong, but no investment decision can be made without knowing where the market sits in its cycle. On STR evidence, London is in the maturity phase: occupancy is close to capacity (83.8% in 2023, 84.8% in 2024, 85.2% October YTD 2025), meaning there are few empty rooms left to grow into. Rate performance is easing, with ADR falling from a 2023 peak of £190.7 to £184.2 in 2025, while RevPAR (revenue per available room) has plateaued at roughly £157–159.
The implication is important: a new hotel cannot enter on the assumption that a rising market will carry it. Growth now has to come from taking share from competitors rather than from total demand.
The supply pipeline tightens this further. Around 3,234 rooms are in the pipeline for the SE1 postcode, and roughly 28,600 across London. Against London Centre South’s existing base of about 12,800 rooms, confirmed schemes alone represent a 6.5% increase in supply, rising to 25% if the wider planning pipeline converts. Most of the near-term supply arriving in 2026–27 is concentrated in the mid-tier and value segments.
Read together, these three findings (flat rates, a full market, rising supply) produce the study’s central strategic conclusion: entering this market with a standard product means competing on price. To survive, a new entrant needs differentiated positioning, strong distribution and a lean cost base. That is precisely where the brand and operating recommendations begin.
Market Outlook
Macro Environment (PESTEL)
The market cycle describes the near term; PESTEL sets out the wider frame the hotel will face across its ten-year operating life. I assessed six macro factors, and the overall picture is balanced: strong tourism demand and a supportive planning environment on one side, rising supply and labour and compliance costs on the other.
From an investment perspective the two most critical rows are Legal and Environmental. Conservation Area status constrains design flexibility and raises development cost, while the London Plan’s net zero carbon and BREEAM requirements increase capital expenditure; in return, they lower long-run operating costs and build ESG credibility with lenders and investors.
| Factor | Key Points | Impact |
|---|---|---|
| Political | UK government targets 50 million international visitors by 2030; Southwark projects demand for 58,000 new hotel rooms by 2041. | Medium-Positive |
| Economic | 43.4 million inbound visits and £33.7bn spend forecast for 2025; London hotel occupancy averaged 82% in 2024; ranked the most attractive European hotel investment market for 2026. | High |
| Social | Hospitality faces 132,000 vacancies, 48% above pre-pandemic levels; demand for "bleisure" and experience-led stays is rising. | Medium |
| Technological | Contactless check-in and mobile keys are now standard; OTA commission structures continue to pressure margins. | Medium |
| Legal | Site sits within the Tower Bridge Conservation Area; National Living Wage rose 6.7% to £12.21/hour, employer NIC to 15%. | High |
| Environmental | The London Plan 2021 requires major developments to reach net zero carbon in operation; BREEAM certification expected. | High |
SWOT Analysis
SWOT Analysis
This section consolidates the findings so far (site, competition, demand, market cycle and macro environment) into a single frame. The left column covers factors internal to the site and concept, which the investor can control; the right column covers external market factors, which cannot be controlled but must be managed.
The conclusion is this: the site’s principal strengths, landmark adjacency and historic character, provide authentic differentiation that competitors cannot easily replicate. Against that, Conservation Area constraints and conversion complexity raise development risk, and the 3,234-room SE1 pipeline stands out as the most material external threat. That balance drives the two decisions in the next sections: a brand that guarantees differentiation, and a lean operating model that contains cost risk.
- Walking distance to Tower Bridge and the Tower of London, in a location with proven hotel demand
- Victorian brick warehouse architecture provides a strong aesthetic foundation for lifestyle positioning
- Strong transport connectivity (London Bridge, Tower Hill, DLR, river bus)
- Proximity to the City of London’s 678,000-strong workforce supports weekday occupancy
- Balanced corporate–leisure demand base reduces seasonality risk
- Gainsford Street has lower footfall than primary corridors, raising reliance on distribution and brand strength
- The building’s position limits scope for view-led rate premiums
- Conservation Area status constrains façade and design changes, raising delivery risk
- Conversion from a car park structure is more complex and costly than new-build
- Bolum has no hotel operating experience, so brand and operator selection is critical
- A design-led "lean luxury" white space exists between full-service upscale and standardised midscale supply
- "Bleisure" and longer-stay trends are increasing demand for flexible room design
- Inbound visitor numbers and spend remain strong, supporting weekend demand
- Strong ESG performance can improve lender and investor access
- Compression demand can be captured in a high-occupancy market
- A 3,234-room SE1 supply pipeline is intensifying competition
- ADR growth is under pressure as new supply comes online
- Labour and operating cost inflation is compressing GOP margins
- Short-let platforms are absorbing price-sensitive leisure demand
- Macroeconomic uncertainty and elevated financing costs are pressuring returns
Concept Recommendation
Ruby (IHG) and a "Lean Luxury" Positioning
The analysis pointed to a clear requirement: a product that differentiates through design without carrying a luxury cost base. The brand that best fits that profile is Ruby (IHG Hotels & Resorts). Ruby’s own "Lean Luxury" concept does exactly this: invest where the guest looks and pays attention (design, bed quality, location, the bar) and save where they don’t (large reception teams, full-service restaurant infrastructure, oversized rooms).
The recommendation rests on three separate grounds. On site fit: Ruby has proven conversion experience, and its compact 15–30 sqm room typology maximises key count within the narrow floor plates dictated by Conservation Area constraints, while the brand’s locally-rooted design language complements the Victorian warehouse character. The approach is already proven at Ruby Lucy (Waterloo) and Ruby Zoe (Notting Hill).
On demand fit: Ruby’s 24/7 bar-led model appeals to both weekday corporate and weekend leisure guests without full-service F&B complexity. IHG’s 120 million loyalty members provide ready-made demand during the first 24–36 months, when a new hotel is at its most vulnerable.
On market fit: against a 3,234-room SE1 pipeline and softening ADR, a lean operating model delivers stronger GOP margins. The proposed £200–£250 ADR band sits above commoditised midscale supply while undercutting full-service competitors, providing resilience against price competition. Self-service check-in kiosks and centralised back-office functions reduce staffing, a direct hedge against the labour-cost inflation identified in the PESTEL analysis, while IHG’s distribution strength mitigates OTA commission pressure.
Operating Structure
Franchise + Third-Party Operator
With the brand chosen, a second question follows: under what legal and commercial structure will the hotel be run? This decision directly determines investor returns, and there are three main options. Under Franchise + Third-Party Operator, the owner signs a franchise agreement with the brand and separately appoints a professional operator to run daily operations. Under a branded Hotel Management Agreement (HMA), the brand provides both the brand and the operation under one contract. Under a lease, the owner rents the building to an operator and receives fixed rent.
Bolum’s profile largely settles the choice: they do not want to operate, but as first-time hotel investors they also need experienced operational capability. My recommendation is therefore the Franchise + Third-Party Operator structure.
The reasoning is as follows. This structure provides immediate access to brand systems and distribution (critical in a market where 78% of the competitive set is branded), hands execution to professionals, and, most importantly, retains exposure to operating-profit upside. A lease would make income more stable, but the tenant would price in risk and set rent conservatively, so value created by the repositioning would accrue to the tenant rather than the investor. An HMA, with its longer and more binding terms, would unduly restrict the flexibility of a first-time owner.
| Structure | How It Works | Advantage | Why Chosen / Rejected |
|---|---|---|---|
| Franchise + Third-Party Operator | Franchise agreement with the brand; a separate professional operator runs the hotel | Brand strength plus operational expertise; profit upside stays with the owner | Recommended: the most bankable and executable route |
| Branded Management Agreement (HMA) | The brand provides both the brand and daily operations | Single counterparty; strong brand standards | Long and binding; limited flexibility for a first-time owner |
| Lease | The building is let to an operator for fixed rent | Predictable income, low operational risk | Tenant prices in risk; repositioning upside does not accrue to the investor |
Financial Projections
A Five-Year P&L and Ten-Year DCF Model
The final step is to test whether all these strategic decisions hold up in the numbers. I built a five-year trading projection (P&L) first, followed by a ten-year discounted cash flow (DCF) model.
On trading, the base case assumes occupancy stabilises in the mid-80% range across 2027–2031. ADR grows from £209 to £230, consistent with the £200–£250 "lean luxury" band identified in the competitive analysis and deliberately unaggressive. RevPAR consequently rises from £177 to £197 and total revenue from £11.21m to £12.44m. The critical measure is GOP (gross operating profit), which grows from £5.53m to £6.19m, a margin of roughly 49%. That margin is the financial expression of Ruby’s lean operating model.
On funding, total development cost is modelled at c.£39.0m (c.£300k per key), financed 60% senior debt / 40% equity: roughly £23.4m of bank debt and £15.6m of investor equity. With debt priced at 6.5% over an 18-year amortisation profile, annual debt service comes to c.£2.21m. Year 1 EBITDA is c.£4.91m, so the hotel generates more than twice its debt payment (a debt-service coverage ratio of c.2.2x), a comfortable margin of safety from a lender’s perspective.
The DCF model then discounts the cash the investor receives over ten years back to today’s value. It assumes an exit (sale) in 2036 at a 10x EBITDA multiple; after repaying outstanding debt, c.£47.4m remains for the investor. Discounting all cash flows at an 11% equity discount rate produces two results: an NPV (net present value) of c.£20.1m and an equity IRR of c.25.8%.
What those two figures mean: a positive NPV shows the project creates roughly £20m of value over and above the 11% return the investor requires. The IRR is the annualised compound return on the equity invested, and 25.8% is a strong outcome for this risk class. Both outputs, however, depend on two conditions: controlling development cost and executing the proposed positioning successfully. Since cost overruns are the most common risk in conversion projects, these results should be read as a scenario contingent on disciplined delivery, not as a guarantee.
Key Trading Metrics
| Metric | 2027 (Year 1) | 2031 (Year 5) |
|---|---|---|
| ADR | £209 | £230 |
| RevPAR | £177 | £197 |
| Total Revenue | £11.21m | £12.44m |
| GOP | £5.53m | £6.19m |
| EBITDA | £4.91m | £5.49m |
Development & Returns Summary
| Item | Value |
|---|---|
| Total Development Cost | £39.0m (~£300k/key) |
| Funding Structure | 60% Senior Debt / 40% Equity |
| Senior Debt Terms | 6.5% interest, 18-year amortisation |
| Annual Debt Service | £2.21m |
| Year 1 Debt-Service Coverage | ~2.2x+ |
| Equity Investment | £15.6m |
| Hold Period / Exit | 10 years, exit in 2036 (10x EBITDA) |
| Equity Discount Rate | 11% |
| Equity Proceeds at Exit | £47.4m |
| NPV (10-Year DCF) | £20.1m |
| Equity IRR | 25.8% |
Conclusion
Conclusion and Recommendation
This feasibility study assessed the conversion of the Q-Park Tower Bridge car park into a c.130-key Ruby lifestyle hotel end to end, and concludes that the scheme is financially viable under the base case: the hotel stabilises at c.86% occupancy and c.£230 ADR by Year 5, generating c.£6.19m GOP (c.49% margin), while the ten-year DCF produces c.£20.1m of NPV and a c.25.8% equity IRR.
The investment thesis rests on three pillars. First, a demand profile that balances weekday corporate with weekend leisure and so reduces seasonality risk. Second, a differentiated positioning targeting the £200–£250 "lean luxury" gap in the middle of a polarised competitive set. Third, brand affiliation to accelerate market penetration in a market where a 3,234-room pipeline is sharpening competition.
On that basis I recommend that Bolum proceeds via a Franchise + Third-Party Operator structure, securing brand-led market entry while handing operational execution to a professional operator. Since the results are most sensitive to development cost and achieved ADR, a final investment decision should not be taken before detailed cost design and binding tender pricing are in place.
Transparency note: the KPIs, 5-Year P&L, Cash Flow (Franchise + TPO) and Mortgage sheets in the underlying financial model are built on template structures prepared by the module tutor; I populated these templates with the project’s assumptions and figures. I built the Competitor Analysis, Amortisation Table and Discounted Cash Flow (DCF) sheets from scratch. I also independently prepared all other analysis and content, including the site appraisal, market, competitive and demand analysis, the SWOT, the brand and operating-structure recommendations, and the full written report.