Tableau · Portfolio Analytics
London Hotel Portfolio Analytics & Underwriting
Institutional Portfolio Screening, Asset-Level Diagnosis and Investment Decision Support
Eight connected dashboards built on 74 worksheets over a 135-asset synthetic London hotel portfolio. Covers portfolio-level trading performance, geographic distribution, investment prioritisation, capital planning, indicative valuation screening, and reconciliation and data-quality controls. A financial underwriting model for selected assets is in development as a separate phase.
Synthetic portfolio data. An internal analytical model, not a formal appraisal or investment recommendation.
The Question
Which Asset Deserves the Work?
This project started from a practical constraint rather than a technical one. An institutional owner holding 135 London hotels cannot underwrite them one at a time. A genuine underwriting model takes weeks per asset: normalised historicals, an operating forecast, a dated capital programme, a debt schedule, an exit value and a set of sensitivities. Building one for every hotel would not just be slow; it would bury the handful of assets that actually merit the attention.
So the question the platform sets out to answer is narrower, and comes first: which of these 135 assets deserve a full financial model, and on what evidence?
Answering it means holding four perspectives together. How effectively is each hotel generating demand and pricing rooms? How much of that revenue survives to GOP and NOI? Does the physical asset carry a capital requirement that will absorb future cash flow? And can the asset support the debt already on it? In most organisations those four questions sit in four different reports, owned by four different teams. The purpose of this build was to put them in one place, in the order an investor actually asks them.
The structure itself is not invented. The departmental P&L hierarchy (departmental profit, undistributed expenses, GOP, NOI) follows USALI, the lodging industry's standard accounting framework, and the screening, benchmarking and valuation logic follows conventions set out in published industry research. Building on recognised practice rather than personal assumption is what makes the output legible to someone who does this professionally.
Where the Portfolio Stands
What the Opening View Shows, and What It Hides
At the 30 November 2025 snapshot, the portfolio reads as broadly stable: TTM RevPAR of £148.9, NOI before debt of £531.1M at a 39.6% margin, £7.2B of CapEx-adjusted value, 47.9% LTV and 1.83x DSCR. Moderate leverage, comfortable coverage, no aggregate distress.
That reading is also the trap. A portfolio DSCR of 1.83x does not mean every hotel services its debt safely — it means the strong assets are carrying the weak ones. A 39.6% average margin does not mean every property converts revenue efficiently. Stable portfolio RevPAR is perfectly compatible with a dozen hotels quietly underperforming their own peer group.
This is why the committee view pairs the headline figures with dispersion: a geographic exposure map, a risk-versus-upside matrix, per-asset LTV and DSCR, capital concentration, and an exception list of priority assets. The aggregate numbers establish that the portfolio is not in trouble. Everything useful after that comes from the spread around them.
How It Works
Eight Dashboards, One Investment Workflow
The eight dashboards are built to be read in sequence, not browsed. Each one narrows the question the previous one raised: the portfolio flags an exception, location explains whether the context excuses it, trading and profitability diagnose the cause, capital and debt test whether it can be fixed economically, and Asset 360 assembles the result into something that can be argued in a room.
The final dashboard does not analyse the portfolio at all. It checks whether the preceding seven can be trusted.
DB01
Investment Committee
The entry point: portfolio performance, leverage, capital exposure and the assets that break the pattern.

The interactive view could not load here. A static preview is shown instead; the dashboard can be opened on Tableau Public.
A committee does not open with operating line items. It opens with whether the portfolio is stable, where risk is concentrated, how much capital is committed, and which assets need to be discussed first. This dashboard compresses those into one screen: RevPAR, NOI, NOI margin, CapEx-adjusted value, LTV and DSCR, set against a geographic map, a priority matrix and a watchlist of exceptions.
The priority matrix plots each asset on investment risk against investment upside, producing four working groups rather than four verdicts. Protect covers assets performing acceptably at controlled risk. Monitor covers assets that are not urgent but have indicators worth watching. Priority Opportunity covers hotels whose upside looks credible relative to the risk they carry. Reposition covers assets where operational, physical or strategic intervention is likely to be required.
None of these is a buy, hold or sell instruction. The matrix allocates attention, and attention is the scarce resource when 135 assets compete for it.
DB02
Location & Market Positioning
Whether performance reflects the asset, or the submarket and segment it sits in.

The interactive view could not load here. A static preview is shown instead; the dashboard can be opened on Tableau Public.
An ADR figure means nothing without context. An airport hotel, a City business property and a central leisure asset carry different occupancy patterns, rate ceilings, weekday–weekend balance, demand mix and cost structures. Compared without that context, the ranking is noise.
This dashboard positions each hotel against submarket, segment, service level, scale, operating structure and its internal peer group. Its purpose is to separate three very different explanations for the same weak number: a soft submarket, a mispositioned asset, or a management problem.
The distinction has direct consequences. A hotel pricing below the portfolio average may be performing exactly as its segment and location warrant, in which case there is nothing to fix. A hotel that looks unremarkable against the portfolio may be materially behind the comparable assets around it, and that is where value is usually recoverable.
Peer comparison here is internal to the synthetic portfolio. It is not a real London market benchmark.
DB03
Trading Performance & Demand
How revenue is actually being produced: by rate, by volume, by season or by segment.
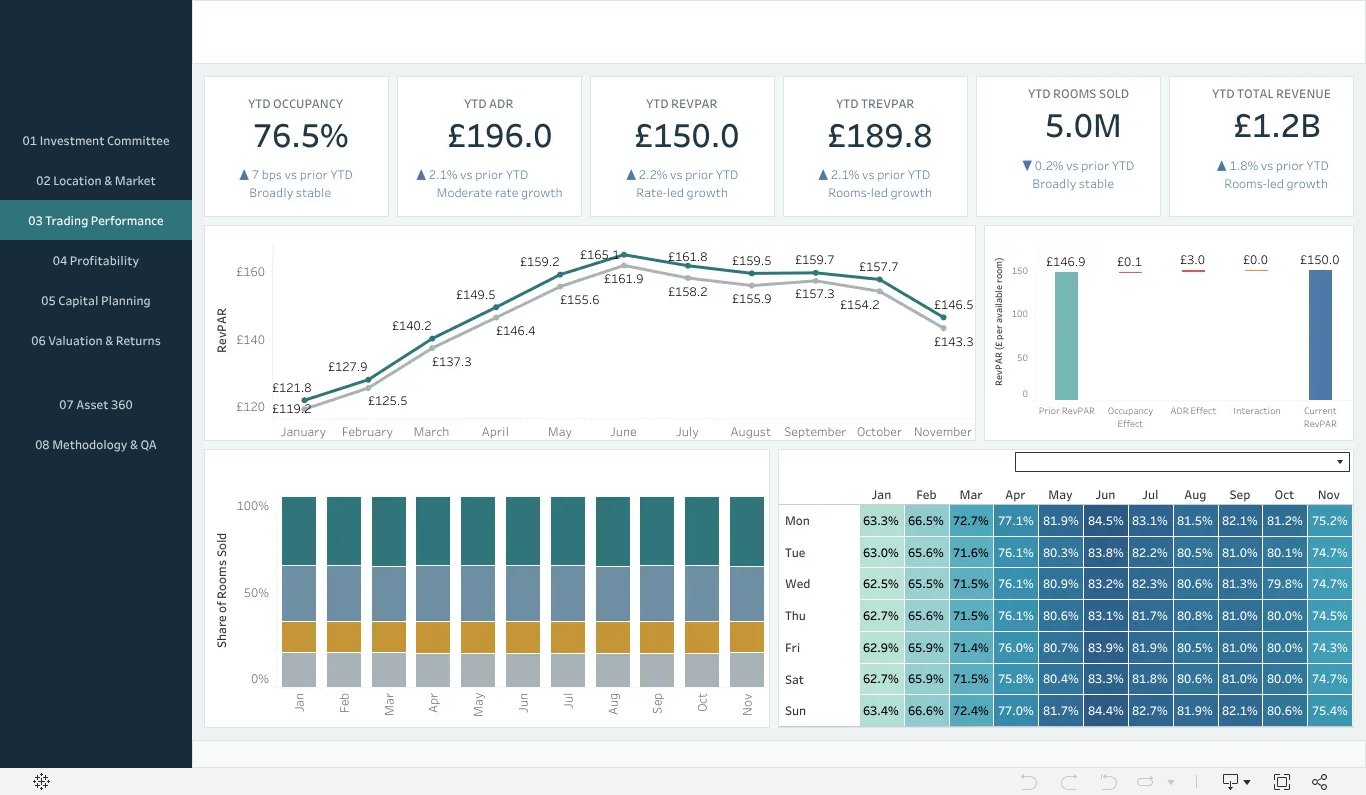
The interactive view could not load here. A static preview is shown instead; the dashboard can be opened on Tableau Public.
RevPAR can improve for reasons that carry opposite investment implications. Rate-led growth on stable occupancy suggests pricing power. Volume-led growth at flat rate suggests the opposite. Growth concentrated in one quarter or one segment may not be growth at all.
The dashboard separates those cases using occupancy, ADR, RevPAR and TRevPAR alongside rooms sold, revenue mix, demand segmentation, weekday versus weekend behaviour, seasonality and a RevPAR driver bridge.
The diagnostic reading matters more than the level. A hotel running near-full occupancy at a weak rate has little room to grow without repositioning — it is already selling everything it has. A hotel holding rate at thin occupancy has a demand problem, not a pricing one. And a hotel with solid rooms revenue but weak total revenue is leaving its F&B and ancillary departments underused. Each of those points to a different intervention, and each becomes a forecast assumption later.
DB04
Profitability & Operating Leverage
How much of the revenue survives to GOP and NOI, and where the rest is lost.
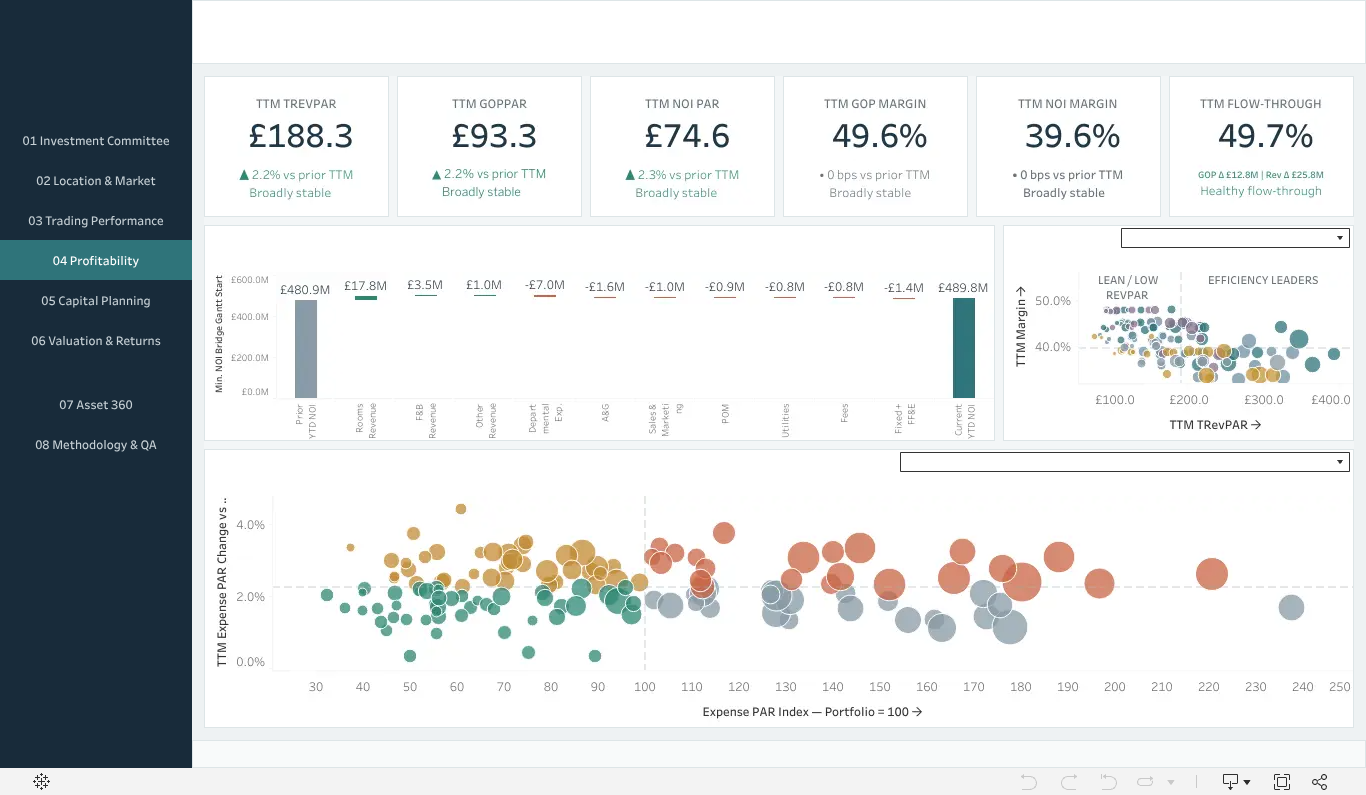
The interactive view could not load here. A static preview is shown instead; the dashboard can be opened on Tableau Public.
Revenue growth is not value creation. A hotel can grow its top line while labour, utilities, distribution and departmental costs grow faster, and end the year with a weaker margin than it started.
This dashboard follows the money from departmental profit through undistributed expenses to GOP and NOI, with flow-through, a year-on-year NOI bridge, an operational efficiency matrix and expense-pressure analysis.
Operating leverage is the reason this page exists, and it cuts both ways. In a strong year, a largely fixed cost base means incremental revenue drops disproportionately into profit. In a weak year, that same cost base makes profit fall faster than revenue. An asset with strong flow-through is more valuable than its RevPAR suggests; an asset with weak flow-through is more fragile than its revenue implies. A high-ADR hotel is not the better investment if its cost structure prevents that rate from reaching NOI.
DB05
Asset Quality & Capital Planning
The hotel as real estate: physical condition, out-of-order exposure and the capital it will demand.
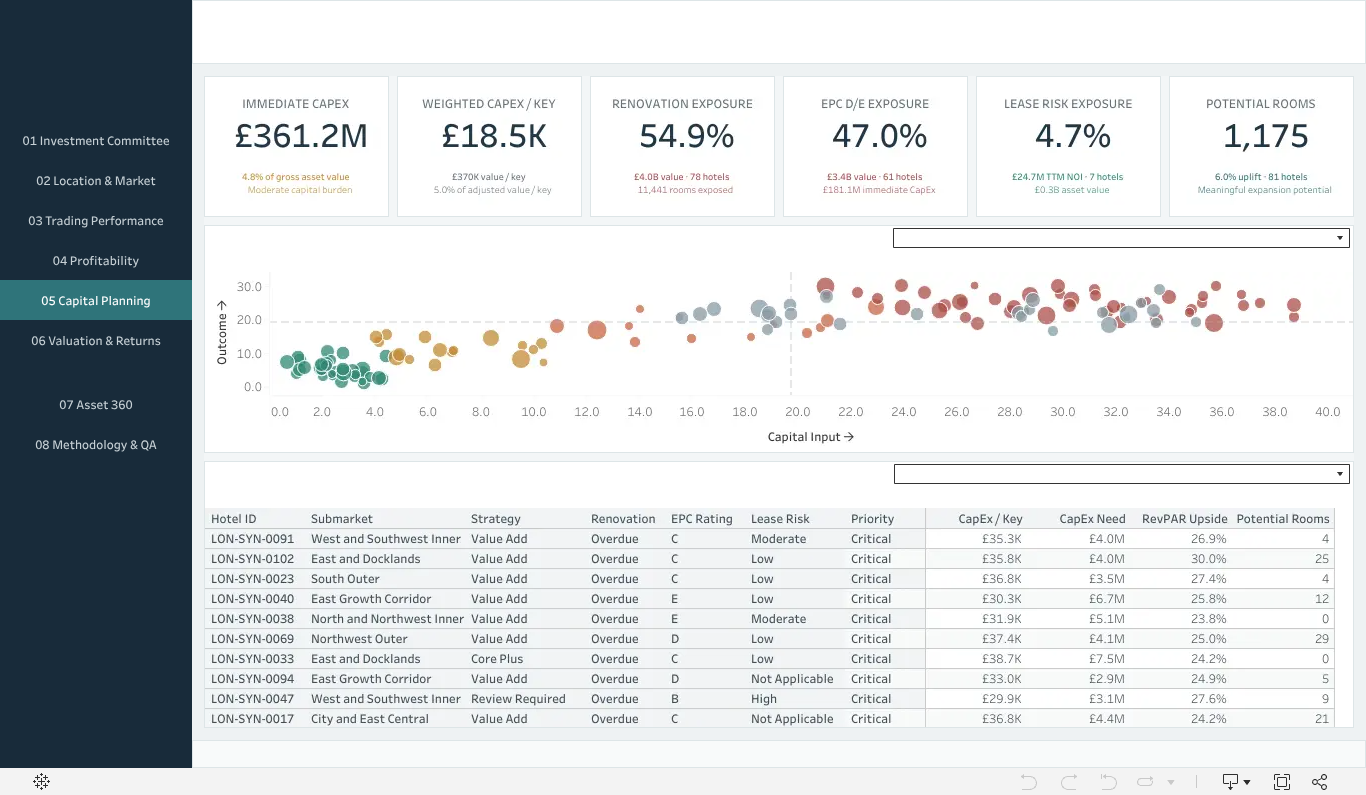
The interactive view could not load here. A static preview is shown instead; the dashboard can be opened on Tableau Public.
Current cash flow says nothing about what the building will need. Guest rooms, public areas, mechanical and electrical systems, technology and FF&E all reach the end of their life on a schedule, and deferring that spend protects near-term NOI at the cost of rate, occupancy, brand compliance and ultimately value.
The dashboard covers out-of-order rooms and the available-room loss they cause, immediate versus longer-term capital requirements, CapEx per key, renovation-due and lease-risk exposure, and how capital demand is concentrated across the portfolio.
Reading it against the trading pages resolves an ambiguity that portfolio screening otherwise cannot. High out-of-order exposure can be the whole explanation for a hotel that looked operationally weak two dashboards earlier. Equally, a large capital requirement means headline value overstates the investor's real position, which is why value is carried through the platform on a CapEx-adjusted basis rather than gross.
DB06
Valuation, Debt & Returns
Where operations meet capital structure: indicative value, leverage and debt resilience.
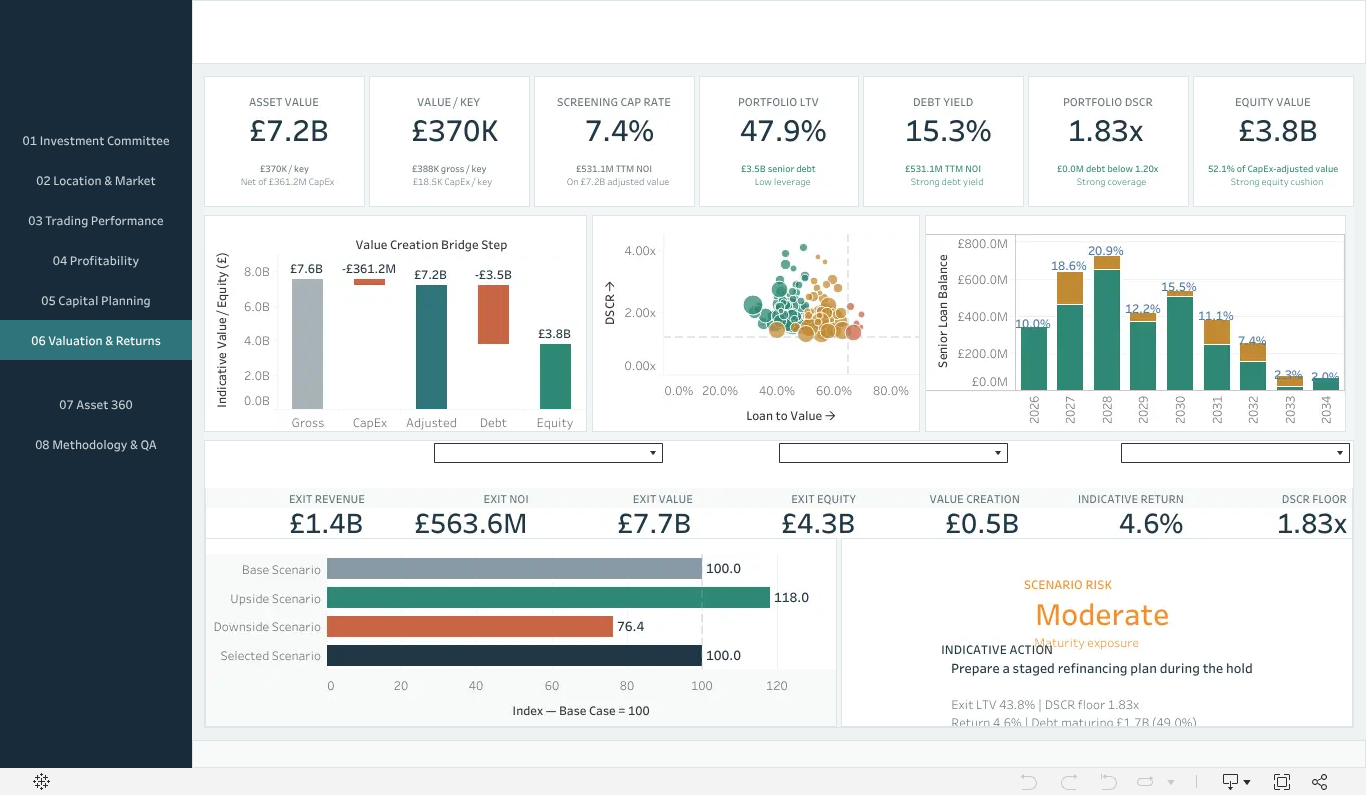
The interactive view could not load here. A static preview is shown instead; the dashboard can be opened on Tableau Public.
A well-run hotel is not automatically a good investment. That depends on what was paid, what still has to be spent, how it is financed, and what the asset can be sold for. This dashboard builds the first bridge between operating performance and investment finance: NOI and screening cap rate into indicative value and value per key, then loan balance, LTV, DSCR and debt yield, with a maturity ladder, an LTV-versus-DSCR matrix and base, upside and downside scenarios.
Leverage is read through coverage rather than in isolation. A low LTV is not reassuring on an asset whose NOI is deteriorating or whose capital requirement is about to consume its cash flow; a moderately leveraged asset with strong debt yield and DSCR is the more financeable of the two. The maturity ladder adds the timing dimension: refinancing risk is a function of when, not only how much.
Scope limitation: These are screening measures. The platform does not contain the dated cash flows required for formal IRR, equity multiple or DCF valuation, and the indicative annualised-return measure must not be read as an IRR.
DB07
Asset 360
One hotel, every dimension: where a testable investment thesis is formed.
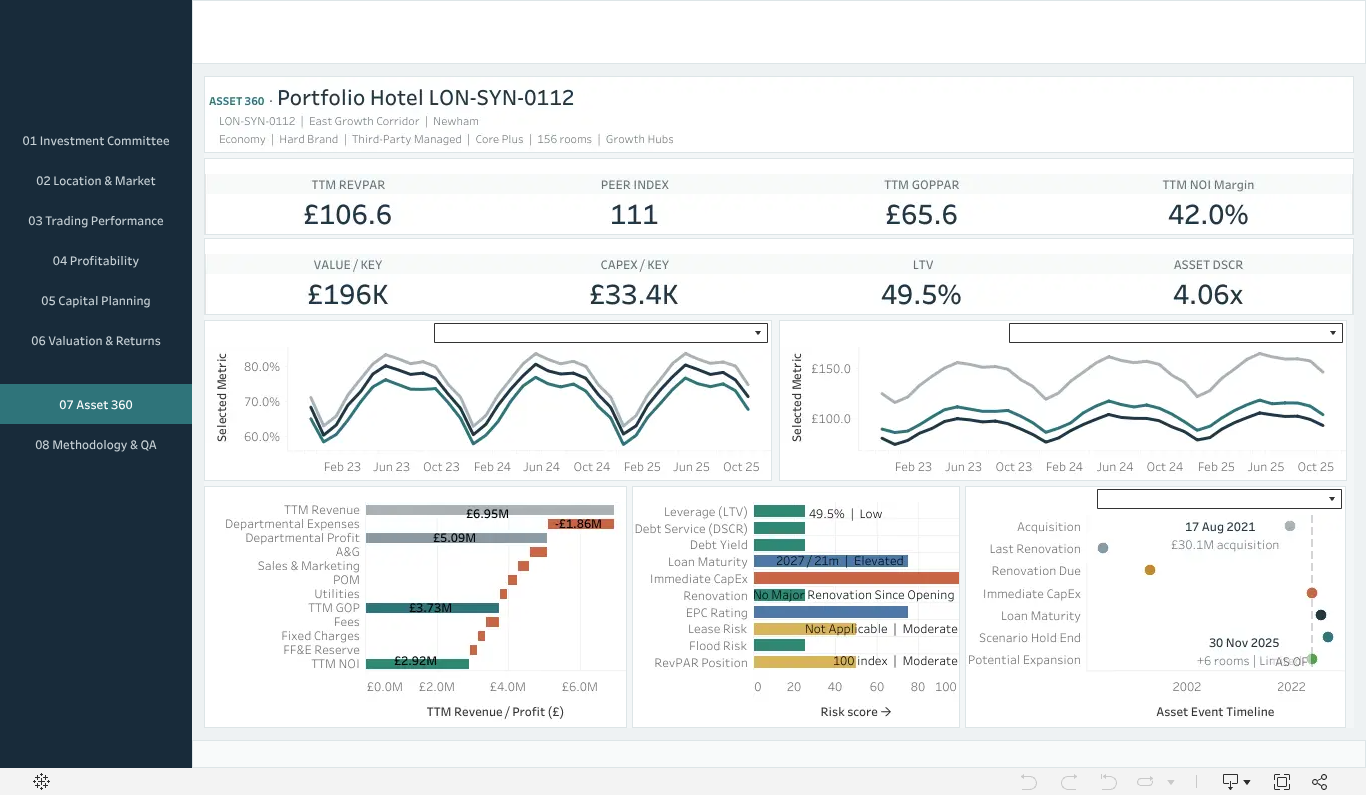
The interactive view could not load here. A static preview is shown instead; the dashboard can be opened on Tableau Public.
Portfolio dashboards find patterns; investment decisions are made on single assets. Asset 360 assembles one hotel's position, trading, demand mix, profitability, capital requirement, valuation, leverage, risk profile and peer standing into a single view, with a revenue-to-NOI waterfall and a capital and debt timeline.
The purpose is to force the separate findings into one coherent account. Is weak RevPAR a rate problem or an occupancy problem? Is the shortfall market-driven or operational? Does the margin issue sit in one department or across the cost base? Would refurbishment plausibly restore pricing power? Does the existing debt structure survive the business plan being contemplated?
The output is a characterisation the next phase can test: a stable asset to protect, a refinancing candidate, an operational turnaround, a refurbishment-led repositioning, a capital-intensive asset with limited upside, or a disposal candidate. This is the handover point: an asset should only enter financial modelling once this view produces a thesis specific enough to be proved wrong.
DB08
Methodology & Data Quality
The control layer: whether the preceding seven dashboards can be relied on.
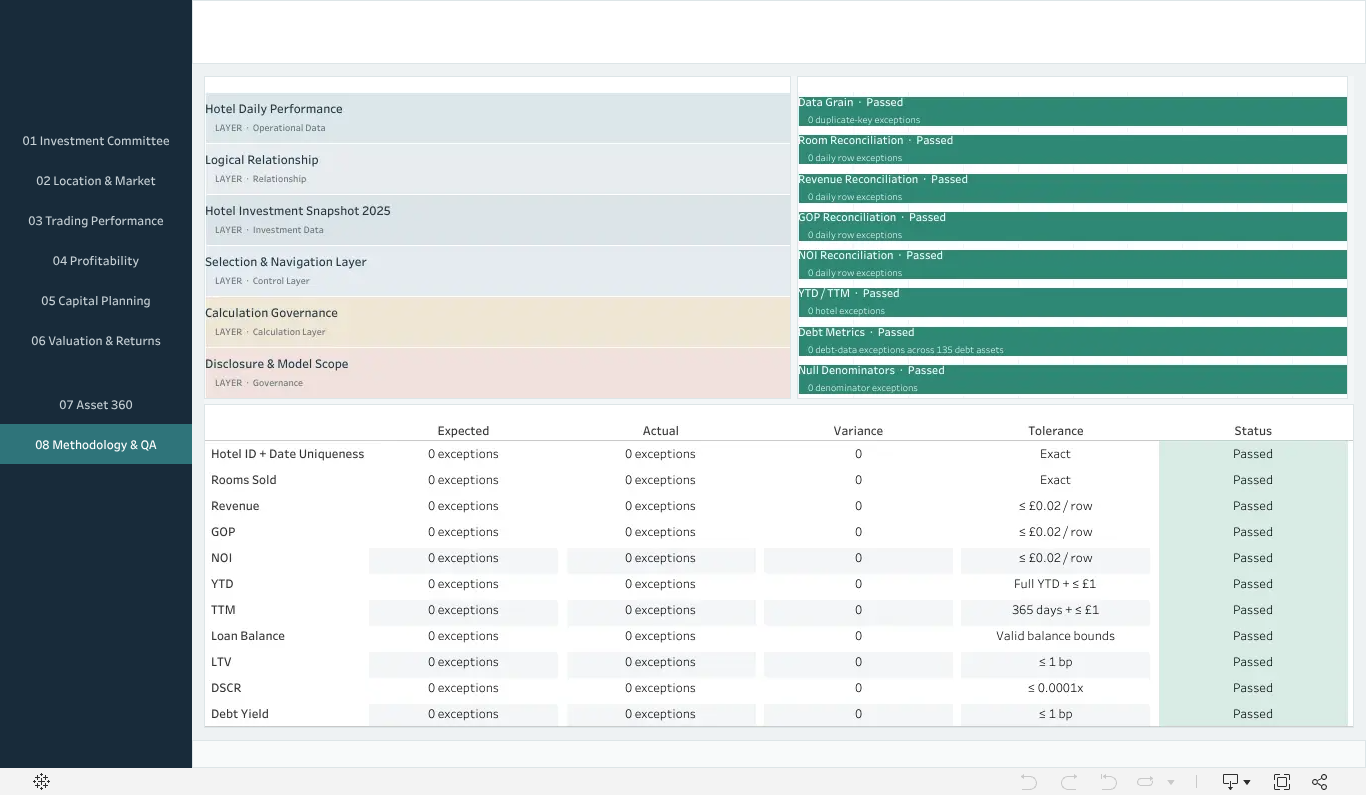
The interactive view could not load here. A static preview is shown instead; the dashboard can be opened on Tableau Public.
A dashboard that looks convincing and reconciles badly is worse than no dashboard. This page documents the data architecture and runs the checks the rest of the platform depends on: hotel-and-date uniqueness, rooms-sold and revenue reconciliation, GOP and NOI reconciliation, a 365-day TTM window validation, YTD-versus-snapshot consistency, independent recalculation of LTV, DSCR and debt yield, loan-balance controls, null checks and zero-denominator guards.
The reconciliation logic matters most where the two data levels meet. Revenue aggregated up from daily trading records has to agree with the annual figures held at property level; where the two diverge beyond tolerance, the asset is flagged before it reaches the committee view.
This dashboard produces no recommendation. It answers a prior question: whether an apparent problem is a real operating issue, a timing difference, a reconciliation break or a modelling limitation. That has to be settled before any of the others are worth answering.
Data
Two Analytical Levels, One Model
The model is deliberately not a single flat table, because the two things it has to describe are not recorded at the same grain.
Daily trading performance: one record per hotel per date
Inventory and available rooms, rooms sold, occupancy, ADR, room and F&B and other revenue, departmental and undistributed expenses, GOP, fixed charges, reserve items and NOI measures. This is what makes trend, seasonality and demand-mix analysis possible.
Property investment snapshot: one record per hotel
Acquisition timing and price, capital improvements, total cost basis, equity invested, original and current loan balance, interest rate, annual debt service, indicative value, LTV, DSCR and debt yield. These are position facts, not time series.
The two are related through Tableau's logical data model rather than joined into one table. The distinction is not academic: physically joining them would repeat each hotel's acquisition price and loan balance across every trading date it has, and any portfolio-level sum of debt or value would be silently wrong by a factor of several hundred.
Relating them instead lets daily operating trends and property-level investment metrics appear in the same view, at the right grain, without that fan-out.
Scope
What the Platform Does and Does Not Decide
Compares assets, isolates outliers, benchmarks against internal peers, tests profitability, quantifies capital exposure, screens valuation, identifies debt risk and prioritises assets for deeper work.
Entry valuation, transaction costs, operating forecast, renovation timing and disruption, financing fees, debt drawdown, interest, amortisation, dated cash flow, exit costs and equity proceeds. None of this exists yet.
The Tableau platform answers which asset deserves further work, and why. The financial model will answer whether, under stated assumptions, the proposed strategy earns an acceptable risk-adjusted return. Valuation outputs here are indicative screening measures and do not constitute a formal appraisal.
Phase Two
Selected-Asset Financial Underwriting
The next phase takes one hotel out of the platform and builds a full investment model around it. The asset will not be chosen because it shows the highest apparent return; it will be chosen because the screening produced a specific, testable question. The strongest candidate combines a defensible location, stable underlying demand, below-peer ADR, a visible revenue-to-profit conversion gap, an identifiable capital requirement and leverage that can still be worked with.
The model will normalise the asset's historicals as a starting point rather than a forecast, then build a five-to-seven-year operating forecast, a dated capital programme including closure and revenue disruption, sources and uses, a full debt schedule, and an exit valuation. Return measures (unlevered and levered IRR, equity multiple, cash-on-cash) will only be reported once those dated cash flows exist.
Crucially, the forecast assumptions have to trace back to the screening. An ADR uplift is only admissible if the platform showed below-peer pricing, a physical constraint being removed, or a repositioning that justifies it. Assumptions inserted to improve the return are the single most common way this kind of model becomes worthless.
Phase Two
Three Strategies, One Comparison
The model will test three mutually exclusive strategies against each other, with refinancing treated as a financing layer that can be applied over the first two rather than as a strategy in its own right.
Hold As-Is
Control caseNormal maintenance, no major intervention, existing operating structure, modest organic growth, existing debt running to term. This is the benchmark: it establishes what the asset returns without a value-creation programme, and nothing else can be judged without it.
Renovate & Reposition
Value-creation caseRoom and public-area refurbishment, possible brand or segment repositioning, revenue-management and distribution improvement. The model must carry both sides honestly: CapEx, professional fees, contingency, rooms out of order, lost revenue, delay and execution risk against ADR uplift, occupancy recovery, better mix, margin improvement and a higher exit value.
Sell Now
Opportunity cost caseRealise current equity value without committing further capital or execution risk: indicative value less selling costs and outstanding debt. This route exists to price the alternative: holding or repositioning has to beat it, and where the capital requirement is disproportionate to the achievable uplift, it frequently does not.
Testing
Scenarios and Sensitivities
A single forecast is an opinion. The model will carry a base case built on defensible central assumptions, a downside testing delayed renovation, cost overrun, slower occupancy recovery, weaker rate uplift, margin deterioration, higher interest cost and exit cap-rate expansion, and an upside built on faster stabilisation and stronger pricing.
The downside is not there to produce a lower IRR. It is there to answer whether the investment remains financeable and whether equity is protected when the plan does not hold. The upside carries the opposite discipline: stronger revenue, better margins and cap-rate compression should not all be assumed to arrive together.
Sensitivity tables will then isolate which assumptions actually drive the outcome: exit cap rate against rate growth and against stabilised margin, CapEx against occupancy recovery, renovation delay against equity IRR, interest rate against minimum DSCR. A committee needs to know not only the expected return, but which single assumption breaks it.
Phase Three
Investment Committee Memorandum
The final phase converts the analysis into a decision. The memorandum will not restate the dashboards or the model; it will carry an executive recommendation, the three or four reasons the strategy should create value, the asset and market context, the historical position, the business plan, the forecast and return outputs, and the principal risks, each paired with a realistic mitigant rather than a reassurance.
The recommendation will be conditional where it should be: a maximum capital commitment, a minimum downside DSCR, a required contingency, a return threshold, or completion of technical due diligence. And the highest headline IRR will not automatically win. The comparison is made on risk-adjusted return, equity requirement, downside protection, debt resilience, execution complexity and strategic fit.
Afterwards
Closing the Loop
Once the model is complete, its outputs can return to Tableau as two further views: an underwriting case study carrying the selected asset, thesis, capital programme, sources and uses and recommended strategy; and a scenario and returns view comparing base, downside and upside against IRR, equity multiple, LTV, DSCR, exit value and the governing sensitivities.
That closes the sequence: portfolio screening, asset selection, underwriting, decision, and then monitoring. It also changes what the platform is for. It would no longer only report how an asset has performed, but whether the business plan the committee approved is actually being delivered.
Audience
Who the Platform Is Built For
The structure follows the questions these roles ask in practice, which is why the same platform serves several of them without modification.
Investment and private equity teams
Screen assets, prioritise due diligence and identify where value creation is credible before committing modelling resource.
Asset managers
Interrogate operator performance, locate where margin is being lost, sequence capital and frame hold, reposition or sell decisions.
Lenders and debt advisory
Identify weak coverage, leverage concentration and refinancing exposure across a portfolio rather than one file at a time.
Valuation and transaction advisory
Support peer benchmarking, operating review and risk identification with a consistent, reconciled evidence base.
Hotel management teams
Establish whether a performance shortfall originates in pricing, demand, cost control or physical condition. Four problems, four different remedies.
Craft
Skills Demonstrated
Attribution
How This Was Built
The workbook is my own. I built the data model, the calculated fields, the parameters, the dashboard logic and the reconciliation and validation rules. Every analytical decision behind them is mine: what to measure, what to benchmark it against, where to set tolerances, and what the output does and does not support.
The analytical structure draws on publicly available industry frameworks and research: USALI for the departmental P&L hierarchy; operating and benchmarking conventions from CoStar/STR and HotStats; and valuation, transaction and market research published by HVS, CBRE Hotels, JLL Hotels & Hospitality, Cushman & Wakefield, Savills and Knight Frank. These shaped how the analysis is structured. No proprietary data from any of them is used: the portfolio is synthetic.
I wrote the underlying data logic while still developing my SQL and Python knowledge, and used AI assistants (OpenAI and Claude) for troubleshooting and technical guidance where I needed it. Those tools helped me build faster; they did not decide what the analysis should say.
Honesty
Stated Limitations
The platform is a screening system, and its boundaries should be read as part of the work rather than as footnotes to it:
Status
Project Roadmap
Want to explore the portfolio analysis?
The full platform is live on Tableau Public, and I am happy to walk through any dashboard or the reasoning behind it.